


 12/08/2021
 3948
3948
Bạn đang ôn luyện IELTS Writing Task 1? Bạn đang cập nhật thêm những bài mẫu IELTS Writing Task 1 line chart mới nhất để luyện tập? Vậy hãy đọc ngay bài thi mẫu Writing Task 1 line chart mới nhất ngày 10-04-2021 và ngày 22-05-2021 dưới đây mà EASY EDU tổng hợp nhé!
I. BÀI THI MẪU MỚI NHẤT IELTS WRITING TASK 1 LINE CHART
1. Bài thi mẫu Writing Task 1 line chart mới nhất ngày 10-04-2021
Đề bài

Bài làm mẫu
The line chart delineates expenditure on different life aspects in an unspecified European country from 1960 to 2000. The initial impression from the chart is that spending on food, leisure, transport and fuel/energy generally decreased, with food undergoing the most dramatic downturn while expenses on transport showed an upward trend.
In 1960, roughly 35% was spent on food, ranking first among the five classifications surveyed. This was followed by leisure (20%), clothing (10%), and transport (9%). Allocations for fuel/energy were insignificant, accounting for only 5%.
Over the next 40 years, spending on food underwent a steady decrease, and by 2000, it had seen a more than twofold drop to its low of only 15%. Similar patterns are evident in leisure, clothing and fuel/energy, with all three categories seeing decreases to 11%, 6% and 4% respectively. In contrast, transport was the only one to see an increase in spending, with its figure amounting to 15% in 2000.
Từ vựng
- Delineate (v): to describe or draw something carefully so that people can understand it. (mô tả chi tiết)
- Expenditure (n): the total amount of money that a government, organization, or person spends during a particular period of time (tiêu dùng)
- Downturn (n): a period or process in which business activity, production etc is reduced and conditions become worse (sự suy giảm)
- Allocation (n): the amount or share of something that has been allocated for a particular purpose (phần dành ra)
- Twofold (a): two times as much or as many of something( gấp đôi)
- Patterns (n): the regular way in which something happens, develops, or is done (xu hướng)
- Amount to (phr.v): if figures, sums etc amount to a particular total, they equal that total when they are added together (đạt được)
2. Bài thi mẫu Writing Task 1 line chart mới nhất ngày 22-05-2021
Đề bài
Bài làm mẫu
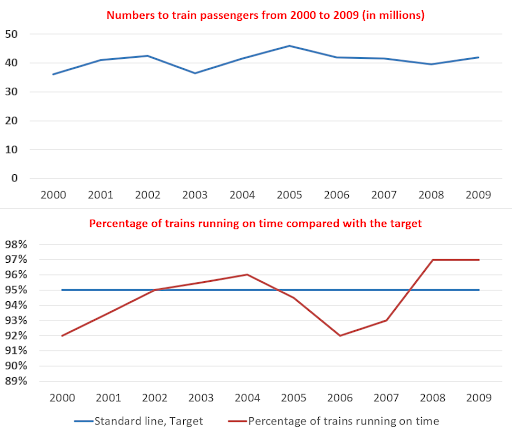
The upper graph illustrates the changes in the number of passengers travelling by train in an unspecified geographical location, and the lower graph shows the proportion of trains running on time in a 10-year period from 2000 to 2009 compared to the fixed target of 95%.
Overall, the number of travellers using trains showed an unsteady upward trend. The rate of trains running on time was also erratic, meeting or exceeding the target from 2002 to 2005, and again from 2008 to 2009.
In the first four years, the number of train travellers rose from around 37 million to its first peak of about 37 million in 2002, before dropping to just below its starting number in 2003. Also in that period, the rate of on-time trains went from an inadequate 92% to a sufficient 95.5%. During the next three years, train passengers rose sharply and hit the most significant peak of around 47 million in 2005; thereafter the figure started declining by approximately four million. In terms of running time efficiency, the rate was 96% in 2004,but later fell drastically to 92% in 2006.
In the last three years, the number of passengers stabilized at around 43 million while the proportion of on-time trains improved gradually and eventually plateaued at 97%.
Từ vựng
- Show an upward trend: cho thấy xu hướng tăng
- erratic (a): something that is erratic does not follow any pattern or plan but happens in a way that is not regular (không đều, khó đoán)
- exceed (v): to be more than a particular number or amount (vượt)
- peak (n): he time when something or someone is best, greatest, highest, most successful etc (đỉnh)
- inadequate (adj): not good enough, big enough, skilled enough etc for a particular purpose (không đủ, không đạt yêu cầu)
- thereafter (adv): after a particular event or time (sau đó)
- Plateau (v): if something plateaus, it reaches and then stays at a particular level (giữ nguyên mức)
📌 Xem thêm: 5 cách paraphrase dễ dàng cho bài IELTS Writing
II. TIPS LÀM BÀI WRITING TASK 1 LINE CHART
Để cải thiện kỹ năng Writing thì không có cách nào khác ngoài việc phải viết thật nhiều. Bạn cần đảm bảo thực hiện các bước quan trọng và tham khảo các tips dưới đây. Có như vậy, bạn mới có thể viết tốt đề IELTS Writing Task 1 Line chart.
1/ 5 Bước quan trọng
- Bước 1: Before Writing – động não & phân tích biểu đồ để tạo ý tưởng và sắp xếp ý tưởng cho bài viết của bạn.
- Bước 2: Make a draft – viết bản nháp đầu tiên, không cần phải quá chỉnh chu hoàn hảo cũng đừng lo lắng về những chi tiết nhỏ mà chỉ cần viết!
- Bước 3: Review – xem lại nội dung và sắp xếp lại các ý tưởng của bạn. Sau đó cải thiện những gì bạn đã viết, làm rõ hơn hay thay đổi cách dùng vựng. Bạn cũng có thể bổ sung thêm thông tin nếu cần thiết.
- Bước 4: Edit – Sửa chính tả, ngữ pháp, dấu câu và bố cục lại bài viết cho rõ ràng.
- Bước 5: Publish – Viết bản cuối cùng và gửi cho những người có chuyên môn hoặc bạn bè đánh giá, take note lại những lỗi sai để né sau này.
2/ Một số Tips cho writing task 1 dạng line chart
Writing task 1 line chart thể hiện sự biến đổi của các thông số theo thời gian. Dưới đây là một số tips giúp mô tả cho bài viết của mình dễ dàng hơn
- Chia bố cục thành 4 đoạn (Giới thiệu, Tóm tắt các ý chính và 2 đoạn mô tả chi tiết)
- Với đoạn văn tóm tắt, bạn cần nhìn vào bức tranh tổng quan của vấn đề – Sự thay đổi của các đường từ thời điểm bắt đầu đến thời điểm kết thúc của biểu đồ (i.e. from the first year to the last). Hay xu hướng của các đường như thế nào (e.g. an overall increase)?
- Bạn không cần đưa ra những con số trong phần tóm tắt mà chỉ nên đề cập đến những thứ chung nhất ‘overall change’, ‘highest’ and ‘lowest’…
- Không được mô tả các đường đơn lẻ vì giám khảo muốn thấy bạn so sánh, thể hiện quan hệ giữa các đường với nhau.
- Phần mô tả chi tiết (đoạn 3) bạn cần so sánh các dòng trong năm đầu tiên được hiển thị trên biểu đồ (ví dụ: năm 1990, số lượng …).
- Sử dụng thì quá khứ đơn (tăng, giảm) để mô tả những năm đã qua và ‘will’ hoặc ‘is expected/predicted to’ cho các năm sau.
- Đừng sử dụng các thể bị động, thì hiện tại tiếp diễn, hoặc quá khứ hoàn thành.
III. LỜI KẾT
Hy vọng những bài mẫu Writing task 1 line chart được cập nhất gần đây sẽ giúp ích cho các bạn. Trong quá trình luyện thi IELTS, hãy thật kiên trì và chăm chỉ để đạt kết quả tốt nhất! EASY EDU chúc bạn ôn luyện thật tốt nhé!
CÙNG CHUYÊN MỤC

5 lỗi sai IELTS Writing Task 2 phổ biến
- 24/10/2021
- 3511

Chiến thuật làm bài Map Labelling trong IELTS Listening
- 24/10/2021
- 3658

Tổng hợp từ vựng IELTS Crime
- 23/10/2021
- 3553

Tài liệu và cách học collocation trong IELTS
- 23/10/2021
- 3934

Lộ trình học IELTS cho người mới bắt đầu
- 23/10/2021
- 3643

Mách bạn trọn bộ Phrasal Verb thường gặp trong IELTS
- 22/10/2021
- 4147

Tips luyện tập IELTS Writing cho người mới bắt đầu
- 22/10/2021
- 3467

Tips nói lưu loát hơn trong IELTS Speaking test
- 22/10/2021
- 3404

Tổng hợp từ vựng IELTS theo chủ đề phổ biến 2021
- 20/10/2021
- 3363


